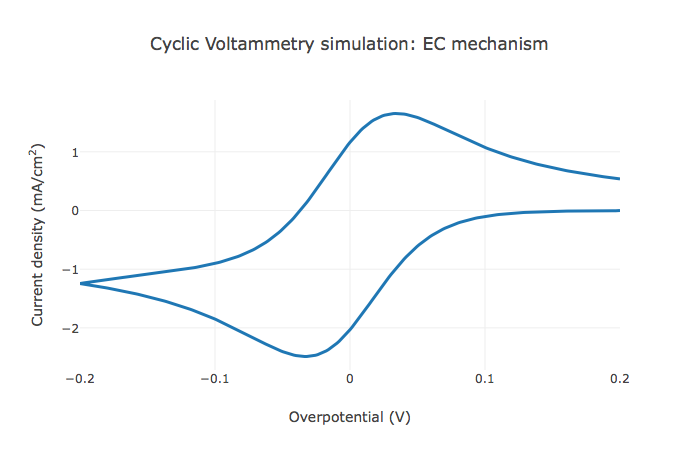
Cyclic voltammetry simulation web app
Two updates on my cyclic voltammetry simulation:
-
I’ve completed the simulation tutorial. This process really helped me understand the underlying equations behind these simulations. As a result, I found some inconsistencies in previous versions of the code and app. If you’re using a version before version 2.0, or code with a date earlier than 9/24, please update to the latest version.
-
I also ported my MATLAB app to the web! You can find it here. I hope this web app can increase the accessibility of simple electrochemical simulations.
For some technical background on how I built it: I tried a few different online charting libraries before settling on plotly.js. I was initially interested in bokeh-server after seeing their demo apps. However, setting up a full server was overkill for this purpose. I then looked at two other Javascript charting libraries. C3.js seemed well-suited for my application, but I couldn’t easily format the axes and legend, and the defaults didn’t look good. Next, I tried Chart.js, but it doesn’t nativly support plotting standard xy data (it supports xy pairs, which is less functional than plotting separate x and y vectors). The plotly.js library was very straightforward to set up and had built-in functionality for saving figures and data— it was clearly designed for scientific applications like my own. Lastly, I used the math.js library for some array manipulations and the w3.css CSS library to create the buttons.
If you’re interested, the source code for the front end and the back end is on GitHub.
